Those of you who frequent the IRC know I've been working on an experimental method to quantify the effects of some of the design characteristics of the blasters we build. What I'm hoping to do here is to give people some guidance on how to perform rigorous, repeatable, useful experiments on their blasters. Science is not for the faint of heart. It requires a significant input of time, money and understanding. It requires good equipment. It requires that you do a lot of boring repetitions. It requires a lot of statistics, and an understanding of those statistics. The fruits of those commitments is the truth.
Currently, when designing a new homemade, or modding an old blaster we really have no idea how far it's going to shoot until we finish it. Sure, there are a few things to guide you (i.e., "put a stronger spring in"), but for the most part it is a complete crap shoot. There is very little good science in this hobby, and I think that's mostly due to the difficulty in measuring the outputs. "Ranges" are an obtuse and misleading indicator at best. Since ranges are only a function of dart weight,
I know of two instruments which can provide accurate readings of a projectile's velocity. The first is a ballistic pendulum. It directly measures the momentum of the projectile, which allows us to measure it's velocity and kinetic energy. I haven't seen any homemade versions of these, but I imagine there is a way to do it.
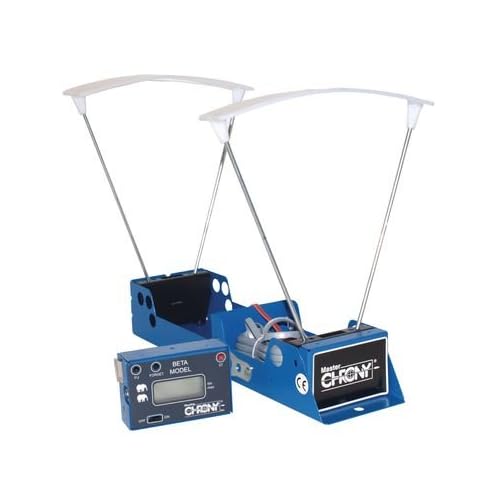
The second, and more convenient instrument is a chronograph. When you shoot a projectile through this, it is detected by two light sensors. An internal clock counts the time between readings, and gives you a velocity readout. Several members of the NIC already have these, and they give very reliable readings.
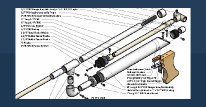
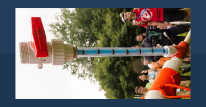
Here's an example of my experimental setup. The SNAP is my testbed, and it allows me to easily test multiple settings. In my case, I'm tested spring types, barrel length, and draw distance. Those are far from the only characteristics to test; plunger diameter, dart weight, plunger weight, plunger friction, dart fit, volume displacement, etc. are all very important.
Firing video
Here's some example data. I also attached a little school lab report I did based on this experiment. It's still in Spanish right now, but eventually I'll be getting around to translating it. The Excel data is more important, in any case. In particular, take a look at all the little statistical tests I do. It might be overwhelming at first glance, but it is representative of the sorts of analysis that is required of this sort of endeavor. FYI, since this particular experiment was a school project, I used streamlines (they are familiar as "toy darts", whereas stefans are not). Regular darts give you much different readings, so this particular data is not super-useful to us.
Some stuff to note from this preliminary experiment:
- Dart fit had an incredibly big effect on velocity
- While variability is high, with 10 runs of each characteristic you can get p values under .1.
- Chronographs require a diffuse incandescent light source. We initially tried a florescent source (pictured above), but that doesn't work, since it flickers imperceptibly. If you are testing indoors, you need to attach the diffusers, and then place an incandescent light bulb over each diffuser. Super annoying, but it works.
- Check out the effects plots, those are probably the most important
Data - Excel
Be sure to check this post again over the next few weeks, as I will be greatly expanding this post as I continue doing experiments. If you came here expecting me to have "solved" springs, then I'm sorry to have disappointed. I'm also calling on the NIC to run their own experiments, so we can replicate some results. Hopefully, we figure out some cool stuff.
Edited by Daniel Beaver, 26 August 2022 - 04:43 PM.


